
The Loop: Closer to Asking, Slower to Sell
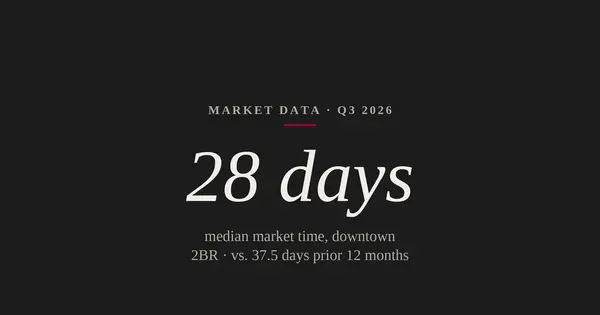
Market data — Q3 2026
The Loop: Closer to Asking, Slower to Sell
Loop 2BR highrise condos took a median 58 days to sell over the 12 months ending September 30, 2026, up from 43 days the year before, and Loop 1BR highrise condos slowed to 62.5 days from 51. Over the same 12 months, 43.9% of Loop condo sales closed at or above final asking price, up from 32.3%. In the Loop, slower has not meant weaker on price.
The Loop Is Taking Longer to Sell
In the Loop, 2BR highrise condos had a median market time of 58 days over the 12 months ending September 30, 2026, compared to 43 days the year before, 15 days slower. Loop 1BR highrise condos moved the same direction, to a median 62.5 days from 51, or 11.5 days slower.
Both figures describe the middle of the market for each unit size, not a typical listing in any particular building. Individual Loop listings land on both sides of the median. The Loop neighborhood page carries the market activity behind these numbers.
The data shows the size and direction of the change. It does not show the reason, and this analysis does not assign one.
But Loop Sellers Are Getting Closer to Asking
Loop condos sold at or above their final asking price in 43.9% of sales over the 12 months ending September 30, 2026, compared to 32.3% the year before. That is a gain of about 11.6 percentage points over a year in which Loop market time lengthened.
The two measures answer different questions. Market time asks how long a listing took to sell. The at-or-above-asking share asks where the sale price landed against the last list price. Over the past year in the Loop, the first got worse and the second got better.
Final asking price means the last list price before the sale, not the first one, so this share measures how sellers fared against the price they ended on. The Research page carries downtown price positioning for Q3 2026 for comparison.
Values in the Same Buildings Held; They Didn't Climb
Among Loop buildings with at least three 1BR and 2BR condo sales in each period, the median building's price per square foot was essentially flat over the 12 months ending September 30, 2026, down 0.8% from the year before, among sales with reported square footage. Eight of those 13 buildings declined.
A same-building comparison sets aside the question of which towers happened to sell. It compares each building to itself, so the result reflects price movement inside buildings rather than a change in the mix of sales. On that basis, Loop values held roughly steady over the past year. They did not rise.
Read together, these findings describe a specific market: Loop sellers took longer to reach a sale and landed closer to their final ask more often, while the price level inside the same buildings stayed about where it was.
Which Towers Sold Can Move the Neighborhood Median
In the Loop, The Legacy at Millennium Park accounted for 16% of 2BR condo sales over the 12 months ending September 30, 2026, up from 8% the year before. 235 West Van Buren moved the other way, from 25% of Loop 2BR sales to 16%.
A neighborhood median is calculated from whatever sold. When one tower supplies twice the share of sales it did a year earlier and another supplies noticeably less, the neighborhood figure can shift even if no individual condo changed value. That is why the same-building measure above matters: it holds the building constant.
The data shows the shift in mix. It does not show how much of any change in the Loop's medians that shift accounts for. The narrower point is that a Loop 2BR median over the past year blends a different set of towers than the year before, and a building-level number is the cleaner comparison.
What a Loop Owner Should Plan Around
For a Loop condo owner thinking about a sale, the findings point to a plan built around time more than price. Based on the past year's medians, a longer marketing period is the realistic base case for 1BR and 2BR highrise units, and a larger share of Loop sellers than the year before closed at or above their final ask.
The building matters more than the neighborhood figure. With the sales mix shifting between towers and most of the measured buildings declining on a same-building basis, the Loop median is a rough starting point. Recent sales in your own building, and in the towers that compete with it directly, carry more weight.
None of this explains why Loop market time lengthened. It describes what a seller can plan around: more time on market, a price anchored to building-level comparables, and less reliance on neighborhood averages.
These figures reflect closed sales through September 30, 2026 (Q3 2026); the next quarterly update replaces them.
Talk it through
If you own a Loop condo and want to see how your building compares on market time and recent sale prices, I can pull the building-level numbers and walk through them with you on a short call.
Book a short callRoz Dupiton is a top real estate advisor and downtown Chicago condo specialist.
Categories
Recent Posts